How To Install Uptime Kuma in Docker
If you've been looking for a selfhosted server monitoring and uptime detector, look no further than Uptime Kuma.
Uptime Kuma is a relatively new player player in the uptime monitoring space. It's a great replacement for Statping, which is no longer being developed and has numerous breaking bugs (for example, not receiving alerts or the dashboard not showing up/down changes until you refresh your browser). Considering I want a self-hosted uptime monitoring application instead of a paid/hosted service like Uptime Robot, Uptime Kuma fits my needs perfectly. Up until now, I've been using Home Assistant to monitor servers.
Follow this guide to install Uptime Kuma in Docker. Within 5 minutes, you can have the container created and have already added all of your sites and services to it.
Considering this is such a new project with regular updates, I expect some things to change over time as well as additional features.
Step 1: SSH into Docker
Open your SSH client of choice (I'm using Termius, but Putty works great as well.).
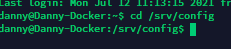
Then, navigate to the folder you wish to install the container. I put all my containers in the /srv/config directory, so I'm going to navigate there.
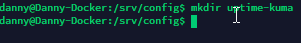
cd /srv/configStep 2: Create an Uptime Kuma directory
mkdir uptime-kumaThen, navigate inside the /srv/config/uptime-kuma directory using:
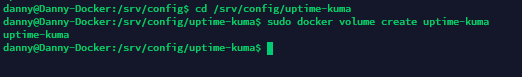
cd /srv/config/uptime-kumaStep 3: Create a Volume
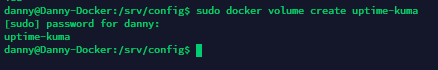
Then type this to create a volume:
sudo docker volume create uptime-kumaStep 4: Create the Uptime Kuma Container
Once the volume is created, create the container with the command below. If you'd like to change the default port from 3001 to something else, change it under the green section.
In red, change the path to the location you'd like the data to be stored
docker run -d --restart=always -p 8008:3001 -v /srv/config/uptime-kuma:/app/data --name uptimekuma louislam/uptime-kuma Step 5: Start the Container
sudo docker start uptimekumaYou should now be able to launch uptime kuma from your docker IP and port you specified (i.e. - 192.168.68.141:8008)
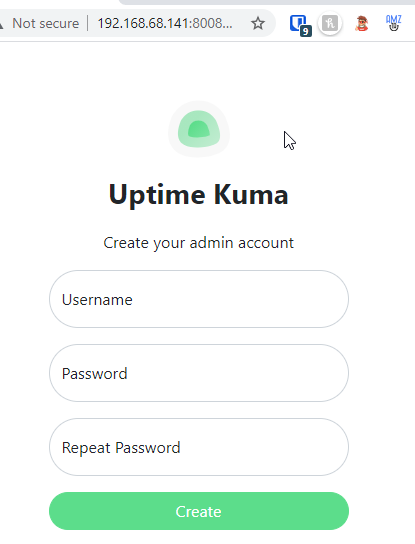
Step 6: Uptime Kuma Initial Setup
Create a username and password, and then log in.
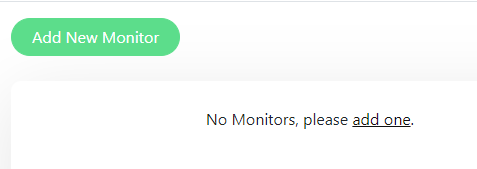
The rest is pretty self-explanatory, but to start you'll want to add a few devices to monitor.
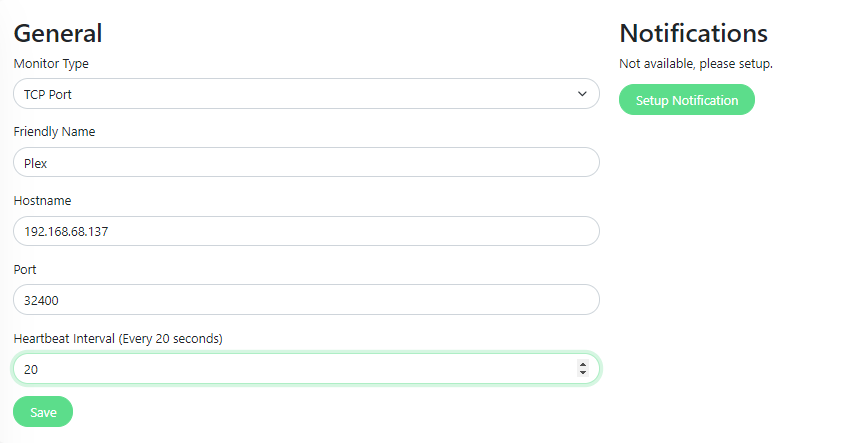
For this demo, I'm going to add Plex as my first monitored application. The heartbeat intervals defaults to 60 seconds but can go as low as 20.
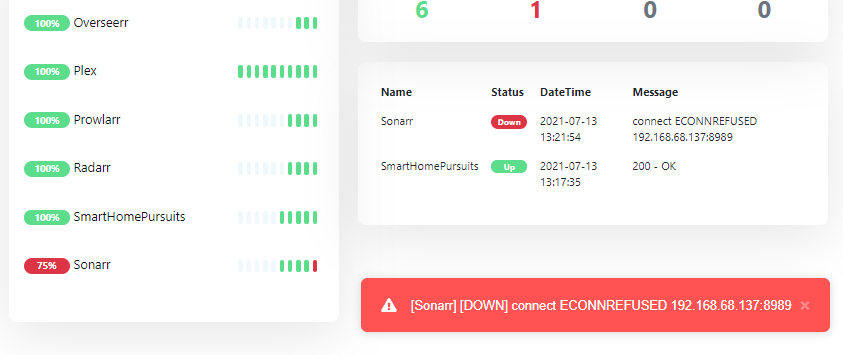
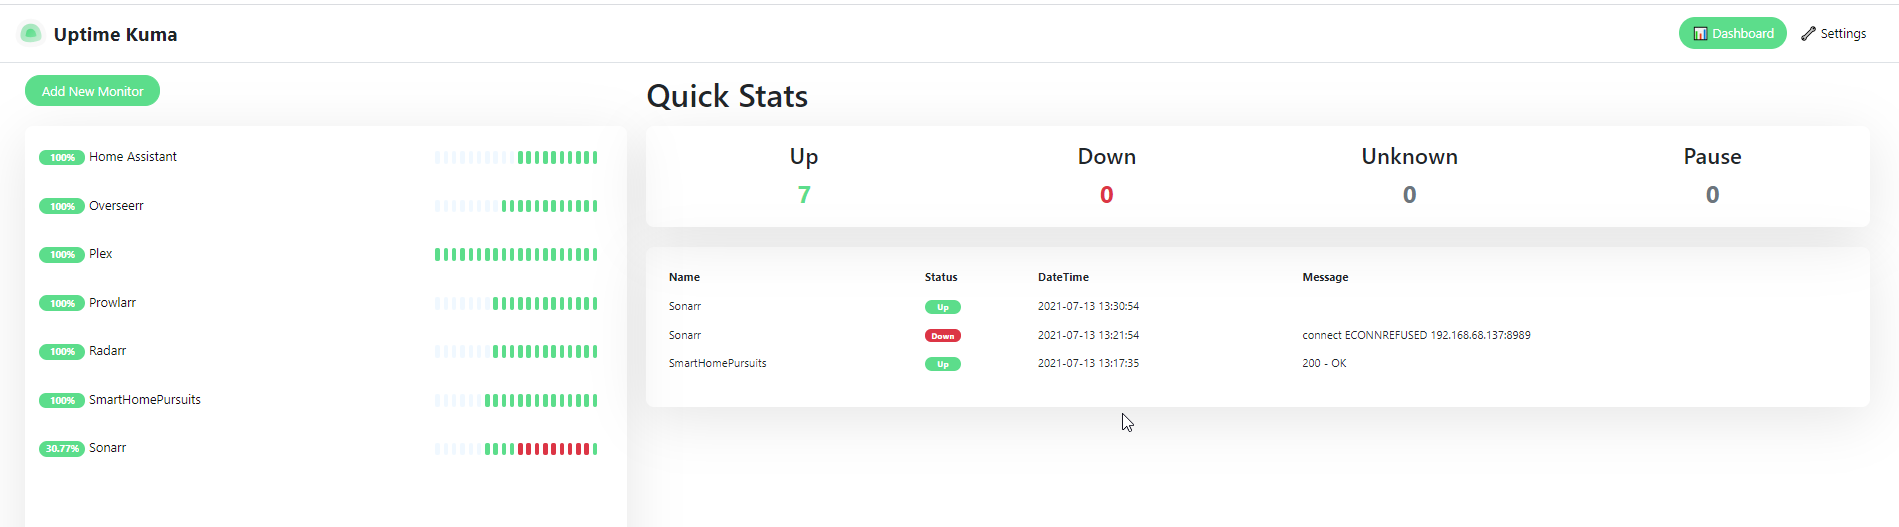
In just a few seconds, you can add all of your self-hosted applications like this. And if something goes down, it shows on the webpage:
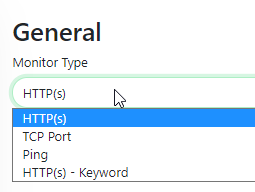
Currently, you can monitor the following types: https/https, TCP port, Ping, or https-keyword.
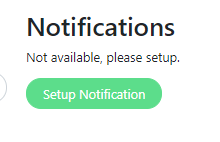
Step 7: Configure Notifications
Notifications can be configured on a per-monitor level. So, if you want some notifications to go to email, but others to go to Telegram, you can do that.
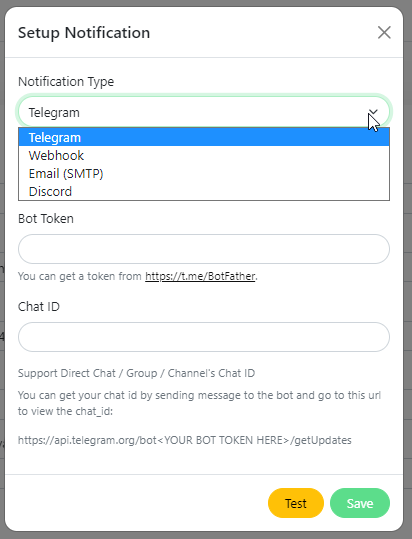
To setup a notification, click into a monitored site and then click Setup Notification. Currently, you can configure alerts and notifications to telegram, webooks, email (SMTP), and Discord.
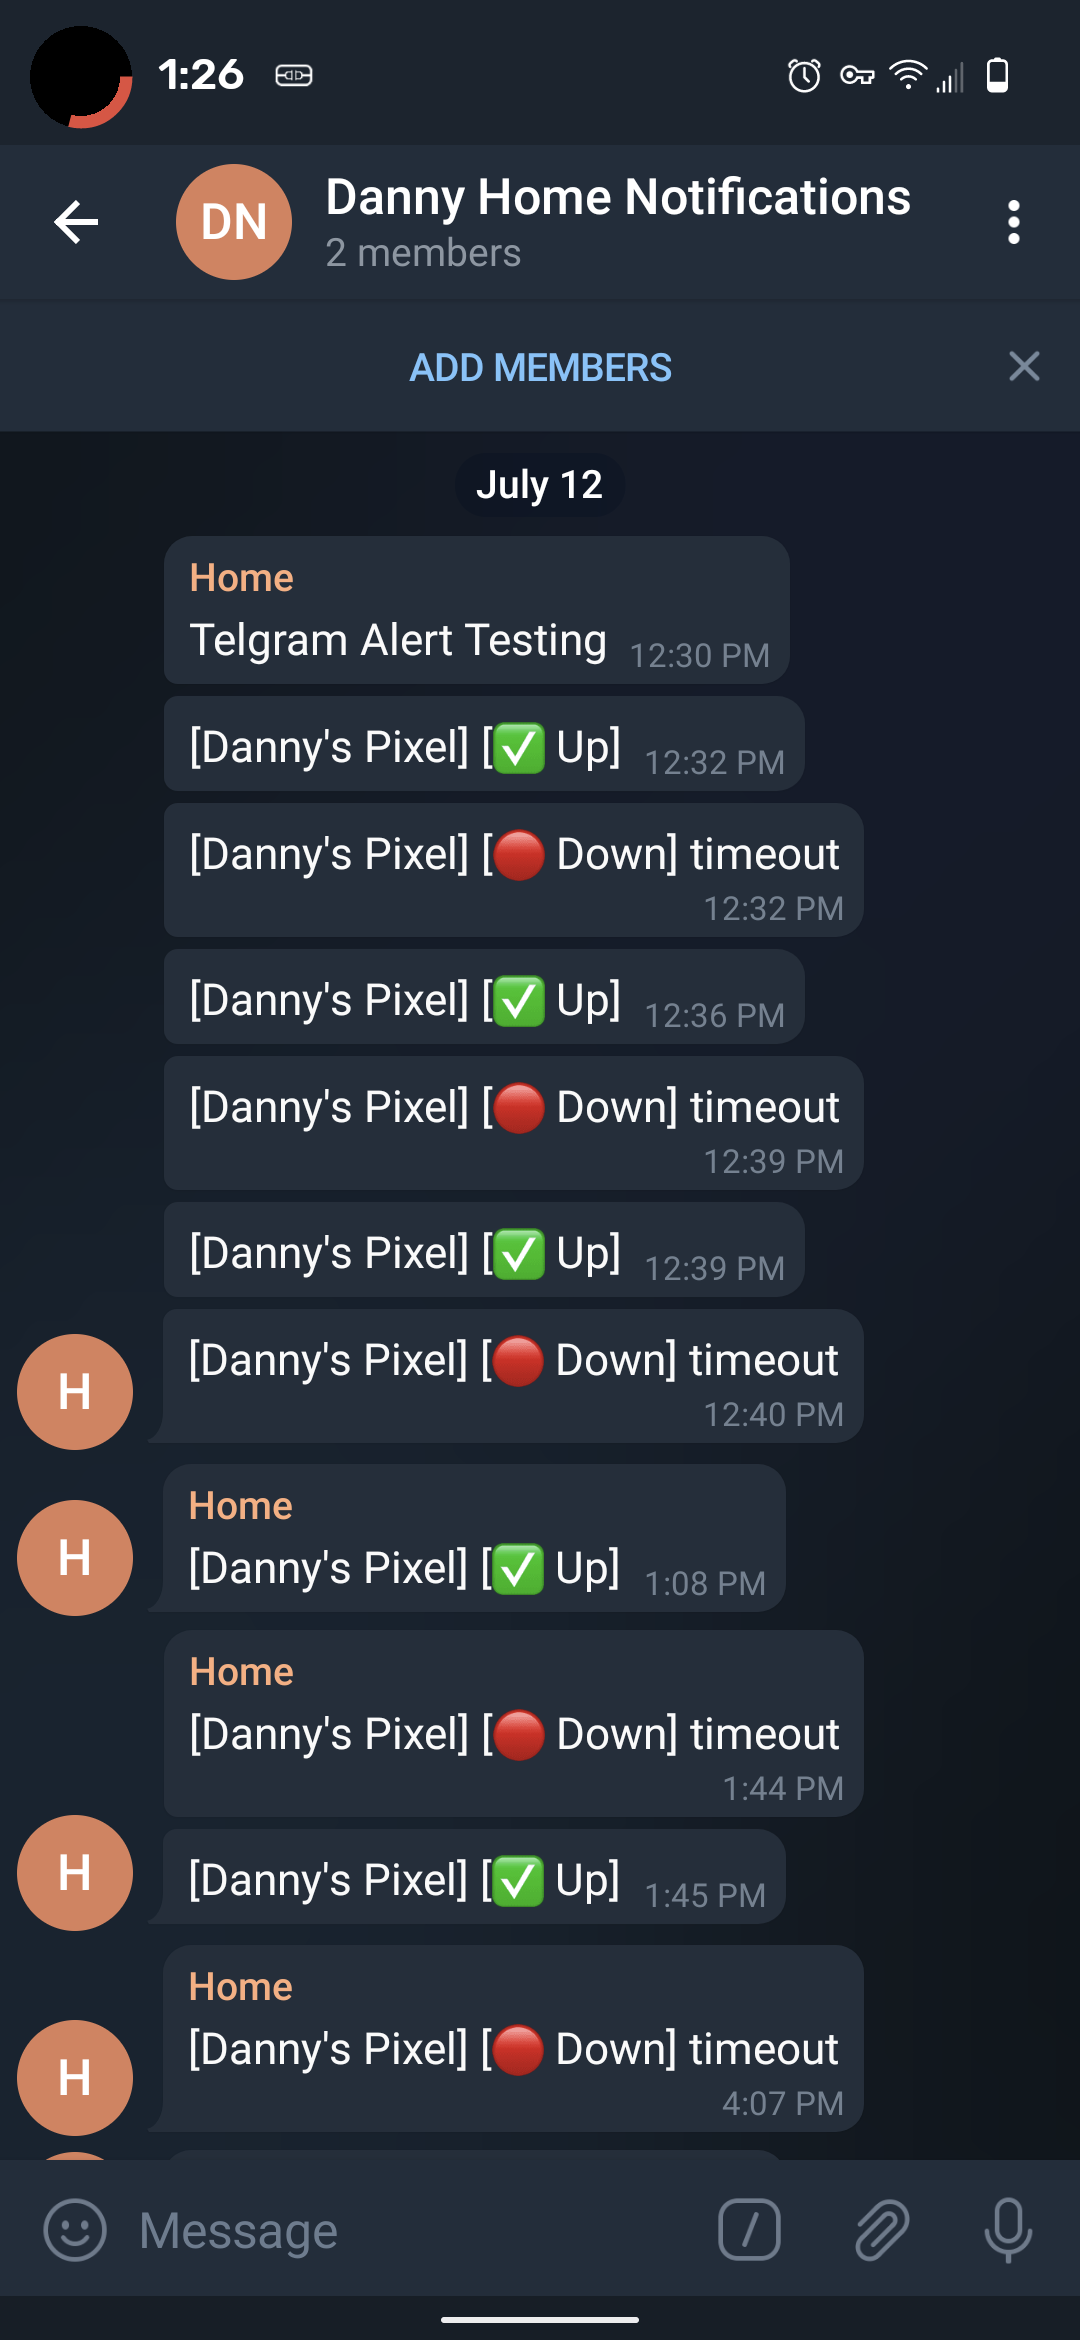
I've only used Telegram so far, but so far it works great so I assume the rest work perfectly as well. If you'd like to send server notifications to Telegram, you can follow my How To Setup a Telegram Notification Bot guide.